EVO-X2
A palm-sized box, a dense 31-billion-parameter language model, and one stubborn law of physics.
We benchmarked Gemma-4-31B-it on the GMKtec EVO-X2 — AMD’s Ryzen AI Max+ 395 “Strix Halo” with 128 GB of
unified memory — measuring how fast it generates text, how hot it gets, how good its answers are, and exactly
where the ceiling sits. Spoiler: the box is fine. The memory bus is the boss.
128 GB LPDDR5Xllama.cpp · Vulkan
Ubuntu 24.04.4Gemma-4-31B-it
conversational speed (about 8 words per second for a single user) with genuinely good answer quality. But every
token-generation number you are about to read is set by one thing and one thing only: memory bandwidth.
Not the GPU’s compute. Not its clock speed. Not the thermals. If you take a single idea away from this post, make
it that one — it explains the speed, the precision trade-offs, and why a fancier GPU wouldn’t help.
unit on factory thermal paste. All speed figures use sustainable
dpm=auto clocks (forcing maximumclocks trips a thermal abort in ~60 s — irrelevant to normal decode). Quality is single-run generative
scoring (n ≈ 56–171 per task) read with the flexible MMLU extractor; a strict regex scores the same
outputs at an artifactual 19%. BBH is unscored (Gemma-4’s
<|channel>thought blockdefeats the harness) and GPQA was skipped (gated dataset). Every figure characterises a dense 31B —
Mixture-of-Experts models scale completely differently. Numbers trace to the CSVs; nothing here is extrapolated.
Why bother running a 31B on a box this small?
The usual way to run a large language model locally is a discrete GPU, and the usual wall you hit is VRAM. A
24 GB consumer card cannot hold a 31-billion-parameter model at 8-bit precision — the weights simply do not
fit. You either drop to an aggressive quant, split the model painfully across cards, or give up.
Strix Halo sidesteps the whole problem with unified memory. The EVO-X2 ships with 128 GB of
LPDDR5X, and the BIOS lets you hand 96 GB of it directly to the integrated GPU. That is enough to hold this
model not just at 4-bit, but at 8-bit, and at full 16-bit precision — with room to spare. The price you pay for
that capacity is bandwidth: LPDDR5X moves data at a fraction of the rate of a discrete card’s GDDR6 or HBM. The
entire post is, in a sense, an investigation of that one trade-off. We wanted to know whether a box you could
post through a letterbox is a real local-inference machine or a party trick.
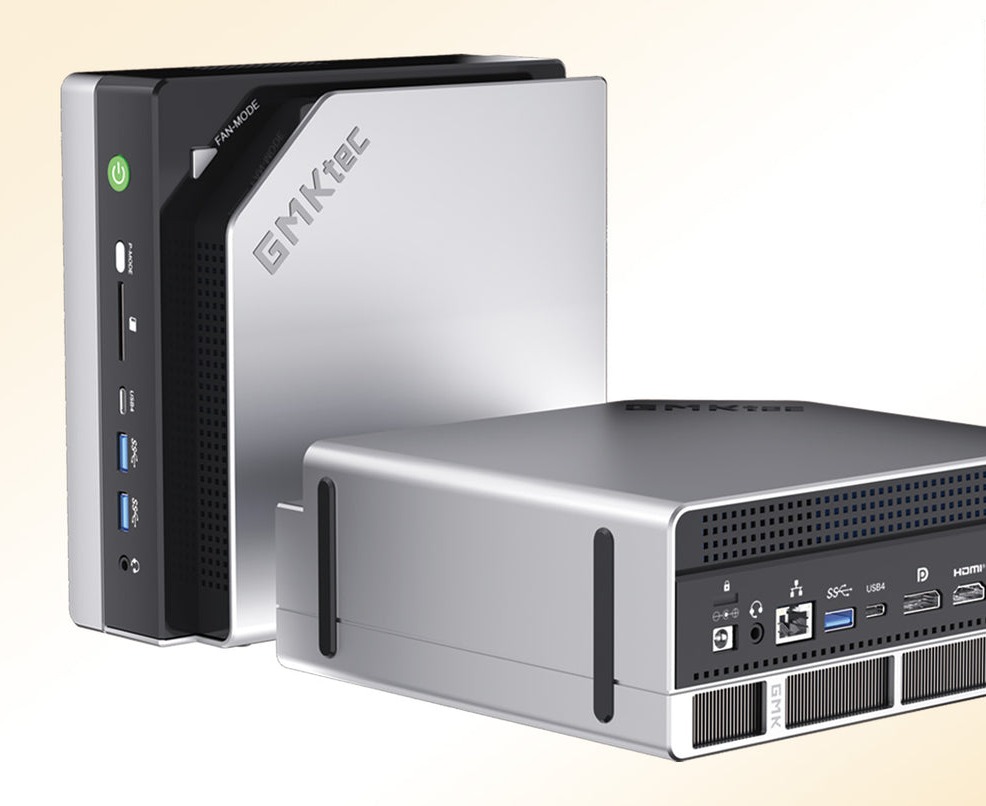
The hardware under test
| Component | Spec |
|---|---|
| System | GMKtec EVO-X2 mini-PC (~$4,500) |
| APU | AMD Ryzen AI Max+ 395 “Strix Halo” — Zen 5, 16 cores / 32 threads |
| iGPU | Radeon 8060S — 40 RDNA 3.5 CUs (gfx1151), ~2.9 GHz, ~59 FP16 TFLOPS peak |
| NPU | XDNA2 (not exercised — llama.cpp uses the iGPU path) |
| Memory | 128 GB LPDDR5X-8000, 256-bit bus — 256 GB/s theoretical, ~212–215 GB/s measured |
| VGM split | 96 GB carved to the iGPU (BIOS UMA) — holds a 61 GB BF16 31B model with headroom |
| Storage | 2 TB NVMe |
| OS / stack | Ubuntu 24.04.4 LTS, kernel 6.17, amdgpu; llama.cpp b9692 (Vulkan/RADV) |
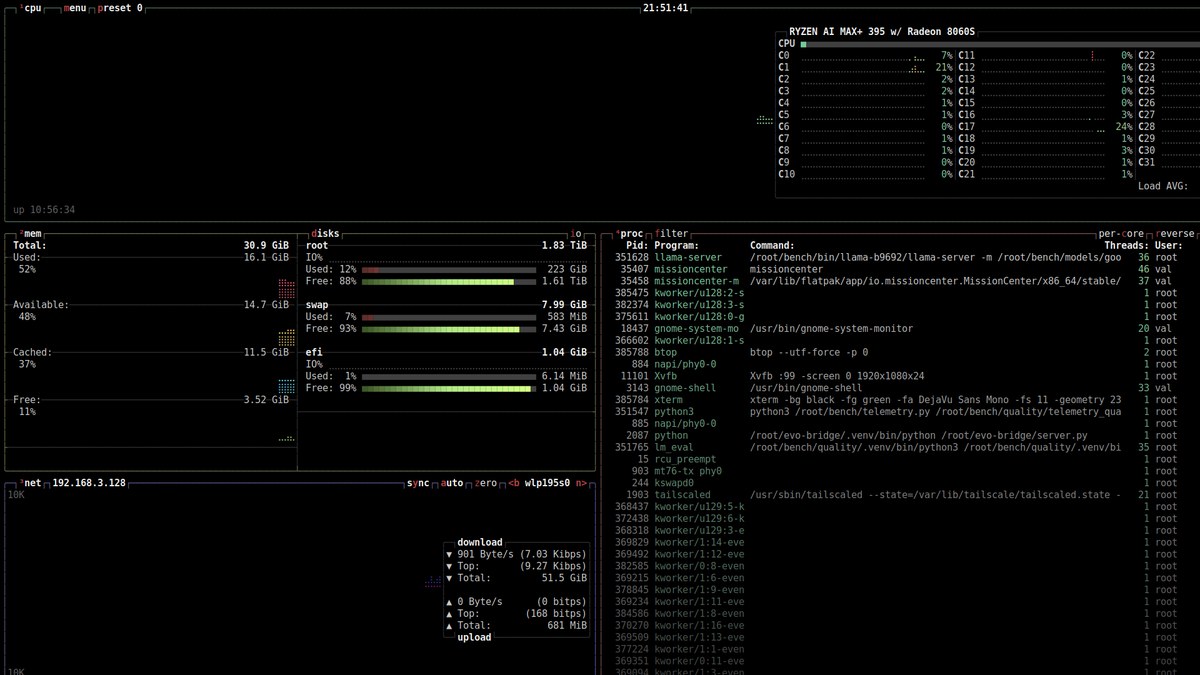
btop. The header names the part — Ryzen AI Max+ 395 with Radeon 8060S — and the core grid shows all 16 Zen 5 cores idling politely while the iGPU does the work and llama-server sits in the process list. For decode, the CPU is a spectator.How we measured
Everything ran on llama.cpp build b9692 (Vulkan/RADV backend, full GPU offload with
-ngl 999), driving google/gemma-4-31B-it from a non-gated GGUF mirror at three
precisions: Q4_K_M (19.6 GB), Q8_0 (32.6 GB) and
BF16 (61.4 GB). Speed came from llama-bench with five repetitions per
data point; across all of them the variance was negligible (σ ≤ 0.06 tok/s), so the speed figures are about
as solid as benchmarks get.
Quality is the part people usually get lazy about, so we will be explicit. We scored the model
generatively — we sent it the actual benchmark questions through a chat server
(lm-evaluation-harness driving
local-chat-completions) and read and parsed the answers it wrote, exactly the way you would use it.
That is harder and slower than the log-probability trick most leaderboards use, but it is the honest way to judge
an instruction-tuned model. Samples were capped and fixed-seed, so treat the quality numbers as
characterization-grade (±3–7% per task), not leaderboard-precision. A 1 Hz sampler logged power,
temperature and clocks throughout, with a 95 °C auto-abort guard watching for trouble. The whole thing ran
headless over Tailscale.
Token-generation speed
Decode — the rate the model emits new text — is the number that matters for chat. Here it is, three precisions,
single stream:
| Precision | Footprint | Decode tg128 | Decode tg512 | Prefill pp512 | Prefill pp8192 |
|---|---|---|---|---|---|
| Q4_K_M | 19.6 GB | 10.85 | 10.68 | 259.9 | 226.8 |
| Q8_0 | 32.6 GB | 6.71 | 6.65 | 272.2 | 239.0 |
| BF16 | 61.4 GB | 3.64 | 3.63 | 102.4 | 97.2 |
| All values tokens/second. Prefill (prompt ingestion) is 20–25× faster than decode and barely sags with context length. | |||||
Stare at the decode column for a second. Halving the weights from Q8 to Q4 almost exactly
doubles the speed: 6.71 → 10.85. Doubling them again to BF16 almost exactly halves it: 6.71 → 3.64. Speed
is tracking model size with eerie precision — and that is not a coincidence. It is the fingerprint of a
memory-bandwidth bottleneck, which is the whole story of this machine.
The memory-bandwidth wall (why every number above is what it is)
To generate a single token, a dense transformer reads every one of its weights from memory exactly
once. So the theoretical maximum decode rate is not some mysterious function of the GPU — it is just arithmetic:
memory bandwidth ÷ model size. Flip that around. Multiply the decode rate we measured by each model’s
footprint, and you recover the bandwidth the GPU was actually sustaining:
decode tok/s ≈ sustained memory bandwidth (GB/s) ÷ model size in memory (GB). Everything below is that equation, measured — and it holds to within a few percent across all three precisions.| Precision | Decode | × footprint | = Effective bandwidth | vs ~213 GB/s real |
|---|---|---|---|---|
| Q4_K_M | 10.85 t/s | × 19.6 GB | 212.7 GB/s | ~99% |
| Q8_0 | 6.71 t/s | × 32.6 GB | 218.7 GB/s | ~103% |
| BF16 | 3.64 t/s | × 61.4 GB | 223.5 GB/s | ~105% |
measured ~212–215 GB/s real bandwidth (independent
clpeak-style tests put it at 201–218 GB/s,so our back-calculation is dead on). llama.cpp’s Vulkan backend is extracting essentially 100% of the memory
subsystem. Decode is purely bandwidth-bound; the GPU’s arithmetic units spend most of their time idle, waiting
for weights to arrive. The single most important sentence in this post: to make generation faster, you need
more memory bandwidth — and nothing else will do. A faster GPU bolted to the same memory bus would generate
tokens at exactly the same speed.
You do not have to take the arithmetic on faith. Here is the GPU during decode, through
radeontop:
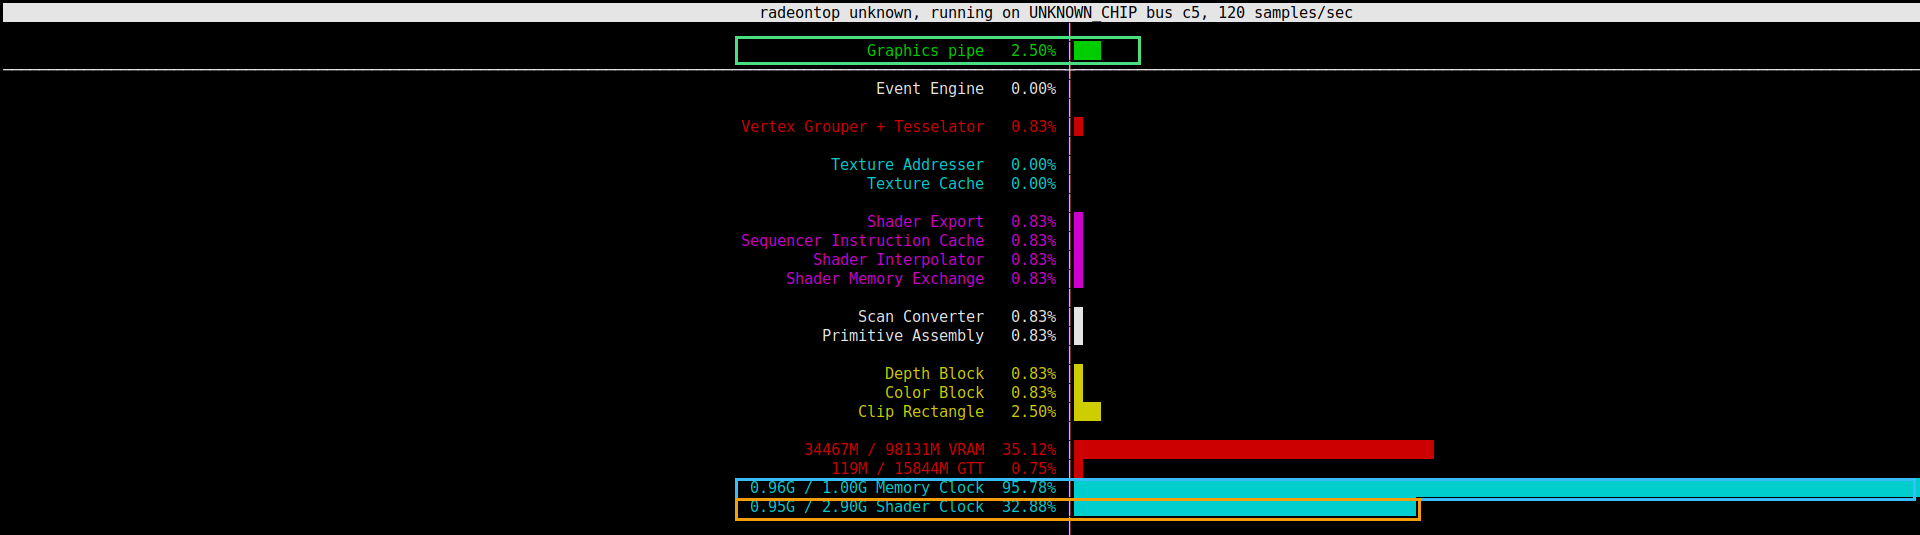
(blue) while the graphics pipe sits at 2.50% (green) and the shader clock has dropped to 0.95 of its
2.9 GHz ceiling (amber) — there is no point clocking the compute up when it is only waiting on RAM.
Memory saturated, compute asleep. That is what “bandwidth-bound” looks like on a monitor. (VRAM: 34 of the
96 GB handed to the iGPU — comfortably holding the model and its KV cache.)
The same physics explains the one number that breaks the pattern: prefill. Reading a prompt is a
matrix-multiply over many tokens at once, so it is compute-bound, not bandwidth-bound — and it runs 20–25× faster
than decode. On a log scale the two live in different worlds:
Solid bars are prefill (reading your prompt); faded bars are decode (writing the reply). The
20–25× gap is why time-to-first-token feels instant even when the model then writes slowly: ingesting the
question is cheap, composing the answer is the expensive part.
The one lever that does work: concurrency
If a faster GPU will not help a single stream, what will? Serving more than one request at a time. When you
batch several conversations together, the GPU reads each weight once and applies it to all of them — the
expensive memory traffic is amortised across the batch. Single-stream decode leaves the arithmetic units idle, so
there is plenty of spare compute to soak up. At eight concurrent streams, aggregate throughput roughly doubles:
Per-conversation speed drops a little under load, but the box as a whole serves roughly twice as
many tokens per second. For a household, a small team, or an agent firing parallel calls, concurrency — not
silicon — is the throughput dial. It is also the only way to beat the single-stream roofline without buying
different memory.
A reality check on the headline numbers
Before the run, we wrote down an estimate: 15–22 tok/s for Q4. The measured 10.85 came in under that, and the
gap is worth dissecting, because it is entirely in our estimate’s inputs, not in the hardware:
| Q4 decode | tok/s | Why |
|---|---|---|
| Pre-registered estimate | 15–22 | used the 256 GB/s theoretical spec + a lighter quant |
| Roofline on real 212 GB/s ÷ 19.6 GB | ~10.8 | the honest ceiling |
| Measured (single stream) | 10.85 | ~100% of that ceiling |
| Measured (8 concurrent) | ~20–23 | batching lands back in the original band |
AMD rates the bus at 256 GB/s; independent testing measures about 212 GB/s in practice — roughly
84% of the sticker. Plug the real number into the roofline and you predict 10.8 tok/s, which is within rounding
of what we got. The lesson is old but evergreen: never benchmark against a spec sheet when you can benchmark
against silicon.
always Mixture-of-Experts models — a Qwen3-30B-A3B, say — where only ~3B of the 30B parameters are
active per token, so the GPU reads roughly a tenth of the memory per step. Gemma-4-31B is dense: every
parameter, every token, no shortcuts. About 11 tok/s is the correct, expected figure for its class. Comparing
the two is apples to orchards.
Are the answers any good?
Speed is meaningless if the model is a fool. We scored four standard benchmarks generatively — the model
writes a full answer, we parse it — which is the realistic way to judge an instruction-tuned model and a harder
test than the multiple-choice log-probability method leaderboards use.
| Task | Measures | Score | n |
|---|---|---|---|
| GSM8K | grade-school math (chain-of-thought) | 93.3% | 150 |
| MMLU (flan-CoT) | broad knowledge | 70.2% | 171 |
| MATH-hard | competition math | 50.0% ±6 | 56 |
| IFEval | instruction-following | 51.7% (prompt) / 46.2% (instruction) | 120 |
A coherent profile for a dense 31B at 4-bit: strong arithmetic, solid general knowledge,
genuinely capable at hard competition math, and middling at fussy multi-constraint instruction-following.
Quantisation to 4-bit clearly did not lobotomise it.
• That MMLU figure is the flexible one. A “strict” answer-extractor scored the same run at 19%, which is
nonsense — it is an artifact of the model formatting its final answer in a way the strict regex misses, not the
model getting 4 out of 5 wrong. The 70.2% from the flexible extractor is the real result. (We mention it because
if you run this yourself and see 19%, do not panic.)
• BBH could not be scored. Gemma-4 writes its reasoning into a separate
<|channel>thoughtblock that the harness’s extractor cannot parse, and the hardest puzzles run past the token budget before
emitting a final answer — so the task scored a meaningless zero. That is a tooling-vs-model-format mismatch, not
the model failing to reason.
• GPQA was skipped entirely. Its dataset is gated on Hugging Face and needs an account token we did not
wire up. No data is better than fake data.
Thermals, power, and a repaste we left on the table
Every speed number above was captured at sustainable clocks (dpm=auto). Here is a full Q4
production run — about ten minutes — sampled once a second:
A genuinely instructive shape. The first ~6 minutes are compute-heavy work (prefill and mixed
load): power sits around 120 W and the edge temperature climbs to its peak of 82 °C. Then the run
shifts into pure decode — and look what happens. The GPU clocks up to its 2.9 GHz ceiling, yet power
drops to ~97 W and the chip cools to ~70 °C. It cannot get hot generating tokens, because
it is starved for memory and most of the silicon is idle. The bandwidth wall even keeps the fan quiet — which matters if this box lives on your desk or runs always-on as a home-inference server.
| Config | Power | Peak temp | Result |
|---|---|---|---|
| Q4 · auto | 133 W | 82 °C | sustained, no throttle |
| Q8 · auto | 131 W | 84 °C | sustained, no throttle |
| BF16 · auto | 125 W | 87 °C | sustained, no throttle |
| Q4 · forced max clocks | 169 W | 95 °C | thermal auto-abort in ~60 s |
(
dpm=high) — power shot to 169 W and the chip tripped its safety cut-out within a minute, on theunit’s factory thermal paste. At default
dpm=auto the box is power-limited, notthermal-limited: it sits in the low-to-mid 80s °C at ~130 W indefinitely, and the cooler has obvious
headroom. A planned PTM7950 repaste would unlock sustained max clocks — and help prefill — but, because
decode is bandwidth-bound, it would not move the headline tokens/sec by a hair. We are leaving that repaste on
the table on purpose: it is the right tease for a follow-up, and a worked example of knowing which knob actually
turns your bottleneck.
What it actually feels like to chat with
For a single user, decode runs at the full 10.85 tok/s, which is about 8 words per second (~485 wpm) —
comfortably faster than you read. The catch is that Gemma-4 is a “thinking” model: it reasons before it
answers, so the wait for a complete reply is dominated not by typing speed but by how much it chooses to
think first.
| Reply type | ~tokens (think + answer) | Wait for full reply |
|---|---|---|
| Quick factual answer | ~80 | ~7 sec |
| Short explanation | ~250 | ~25 sec |
| Detailed / reasoned answer | ~600 | ~55 sec |
| Heavy reasoning (math, multi-step) | ~1,200+ | ~2 min |
Time-to-first-token is well under a second for short prompts — prefill is fast, remember — so the
model starts replying immediately and then streams. For interactive use Q4 is the right pick; Q8 would be ~40%
slower for answers most people cannot tell apart from the 4-bit ones. And at roughly 12 joules per token,
~$1 of electricity per million output tokens, and ~125–133 W flat-out (precision-dependent) — about one bright incandescent bulb — the
running cost of a private 31B is closer to a hobby than a server bill.
The engineering trail (where the real lessons hide)
The benchmark numbers were the easy part. Getting to them surfaced a string of failures that are worth more
than the table they produced — most of them specific to running a brand-new thinking model on a brand-new
AMD APU, where the open-source stack has not quite caught up. In confession order:
timeout=1800, eight retries.-c 8192 split across --parallel 8 leaves just 1024 tokens per slot — shorter than a chain-of-thought GSM8K prompt, which the server rejected with a flat HTTP 400. Raising the context to -c 65536 fixed it. Easy to miss: the number you set is not the number each conversation gets.If there is a meta-lesson, it is that benchmarking a new model on new silicon is 20% running
benchmarks and 80% building the scaffolding that lets the benchmarks run unattended without lying to you. The
numbers are only as trustworthy as the harness that produced them — which is why we built a 2 Hz telemetry
logger, a 95 °C auto-abort, a watchdog and recovery scripts before trusting a single figure.
The verdict
Can a mini-PC run a 31-billion-parameter model? Comfortably. The EVO-X2 holds Gemma-4-31B at three precisions,
generates text faster than you read, answers grade-school maths at 93% and competition maths at 50%, sips
~125–133 W (precision-dependent), and never breaks a sweat at default clocks. For a private assistant, a household LLM, or a low-volume
agent backend, it is a quietly remarkable little machine — and the unified-memory trick is the reason a 24 GB
discrete card simply cannot play this game.
But buy it with your eyes open. Single-stream generation is pinned at the memory-bandwidth wall — about 11
tok/s for a dense model this size — and no amount of GPU, clock speed, cooling or thermal paste will move that
number. The levers that do work are concurrency (batch your requests and double your throughput) and
precision (Q4 is the sweet spot; the quality cost over Q8 is hard to find). If your workload is many small
parallel calls, this box punches far above its size. If it is one user demanding maximum single-stream speed on a
dense model, you are buying capacity, not velocity — and you should know that before the courier arrives.
FAQ
Would a faster GPU make it generate tokens faster? No — not for single-stream decode. Generation is
bottlenecked by how fast weights stream out of memory, and the Vulkan backend already extracts ~100% of the
256-bit LPDDR5X bus. More compute would sit even more idle. Only more bandwidth, or batching, raises the
ceiling.
Why is Q4 faster than Q8 and BF16? Because decode speed is bandwidth ÷ model size, and a 4-bit model
is half the bytes of 8-bit and a quarter of 16-bit. Fewer bytes to read per token, more tokens per second. The
speeds scale almost exactly with footprint, which is the proof the bottleneck is memory.
Is the 4-bit version noticeably dumber? Not in our testing. Q4_K_M scored 93% on GSM8K and 70% on
MMLU; the quality gap to Q8 is small enough that for chat we would not bother with the 40% speed penalty Q8
costs. Run Q4 unless you have a specific reason not to.
Can I run this myself? Yes. It is stock llama.cpp
with the Vulkan backend, a GGUF of the model, and -ngl 999 to put every layer on the iGPU. You do
need to carve enough VGM to the GPU in the BIOS (we used 96 GB) and enough headroom that
systemd-oomd does not reap the process when the model pages into unified memory.
Why does the GPU monitor “pulse” instead of sitting at 100%? That is normal for batched eval of a
thinking model: each wave of requests spikes the GPU, holds through decode, tapers as a few keep “thinking”,
then a brief valley while the harness parses answers and builds the next batch. The valleys are prep, not
stalls.
What about the NPU? The XDNA2 NPU was not exercised — llama.cpp’s path here is the iGPU via Vulkan,
which is the mature, full-layer-offload route today. The NPU, and the ROCm backend, are both unbenchmarked and
on the list for a future run.
Glossary
Decode / token generation — the model writing new text, one token at a time. Memory-bandwidth-bound here.
Prefill / prompt processing — the model reading your prompt, all tokens at once. Compute-bound, 20–25× faster than decode.
Quantisation (Q4 / Q8 / BF16) — how many bits store each weight. Fewer bits = smaller model = faster decode, with some quality cost.
Memory bandwidth — how fast data moves between memory and the GPU. The hard ceiling on decode speed for a dense model.
Roofline — the simplest performance model: max decode rate = memory bandwidth ÷ model size. When you hit it, you are done.
Unified memory / VGM — one pool of RAM shared by CPU and GPU; “Variable Graphics Memory” is the slice the BIOS hands to the iGPU.
Dense vs MoE — a dense model reads every parameter per token; a Mixture-of-Experts model reads only a fraction, so it decodes far faster for the same parameter count.
tok/s — tokens per second. A token is roughly ¾ of a word.
Generated 2026-06-19 from measurements on host evo-x2. Speed figures are highly
repeatable (σ ≤ 0.06 tok/s, N = 5); quality figures are single-run capped samples (n ≈ 56–171,
characterization-grade). Charts are inline SVG with no external dependencies — they render offline. This is a
build-and-benchmark log; another one on this blog —
why your inverter lies
about LFP state-of-charge — takes the same measure-don’t-guess approach to a home battery.